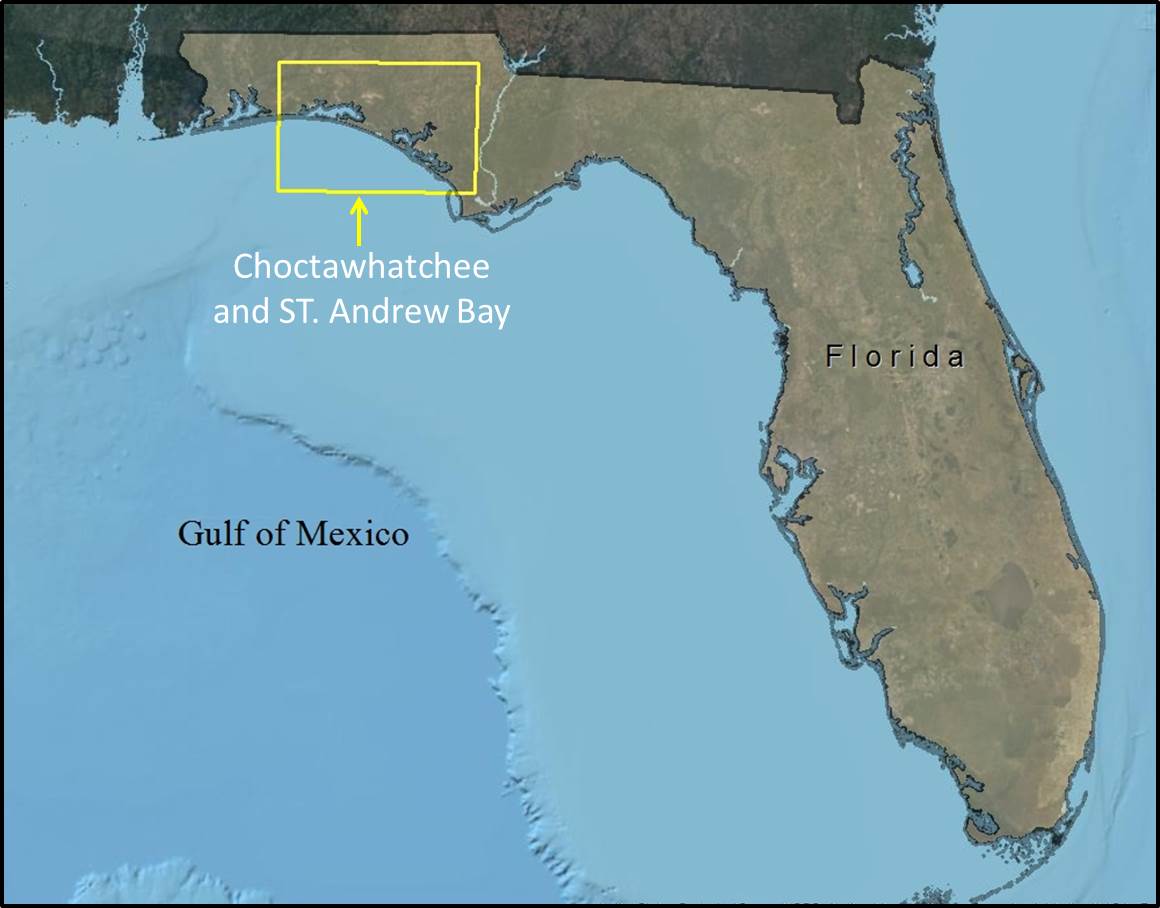
Currently, two bay systems in Florida, Choctawhatchee and St. Andrews, which are located in the Emerald Coast region of the Florida Panhandle, have been analyzed using both the SLAMM and ADCIRC models, and conservation indicators developed.
Click to enlarge.
Study Areas:
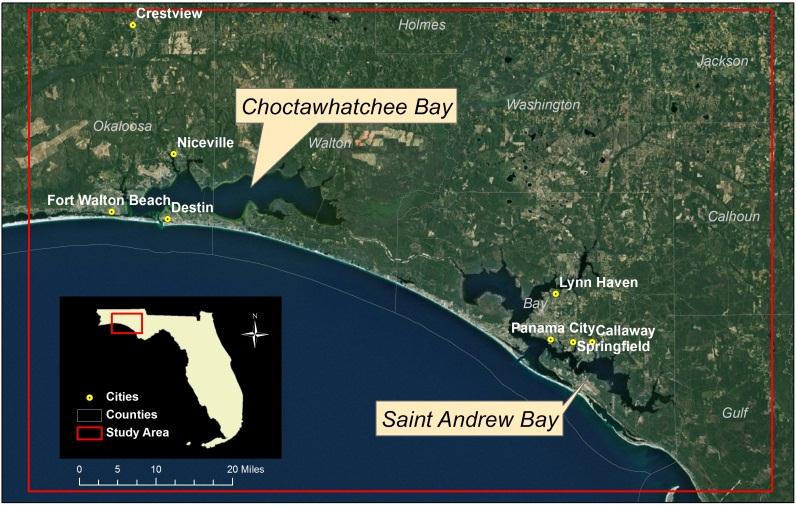
Figure 1. Saint Andrews and Choctawhatchee Bays study area.
Choctawhatchee and St. Andrews Bays
These two bays system has four basic natural habitats: shallow slope areas (vegetated, unvegetated, and oyster beds), deep central basin regions (unvegetated), bayous, and a river delta area. Soft, sandy soil, intense rainfall, and topographical relief make this area highly susceptible to erosion, particularly after removal of vegetative cover, during road and housing construction, and with agricultural activities. These two bay systems lay between Pensacola Bay to the northwest and Apalachicola Bay to the southeast.
Choctawhatchee Bay
Choctawhatchee Bay is within Okaloosa and Walton Counties and St. Andrews Bay is within SSSSSS counties. The main population centers long the shoreline are Panama City in St Andrews Bay, and Destin and Fort Walton Beach in Choctawhatchee Bay. There are two Air Force Bases in the area: Eglin and Tyndall, which hold a substantial amount of land in the region. The study area encompasses more than XXXX acres surrounding these two bays (south of I-10 highway). Choctawhatchee Bay is more than 27 mi long and up to 6 mi in width. It receives most of its freshwater inflow from the Choctawhatchee River that supports a dynamic delta, that creates a diverse ecology and substantial economic and quality of life to residents.
St. Andrews Bay
St. Andrews Bay covers an area of 68,480 acres. It is a fragile ecosystem because of its high-salinity waters, the depths of the bay, the lack of significant freshwater inflow from land drainage, and the minimal tidal regime. Its primary source of freshwater is Econfina Creek, which has an average discharge of just 538 ft3/s). Because of the absence of a large river emptying into St. Andrews Bay, there is little sedimentation and associated turbidity in this bay. St. Andrews Bay is uniquebecause of its wealth of biological diversity. Keppner (2002) documented the diversity associated with the bay and compared it with surveys of Indian River Lagoon, Fla., which has been touted as the most biologically diverse estuary in North America.
Analyses:
SLAMM
The following images show SLAMM landcover maps derived from the Sea Level Rise Affecting Marsh Model (SLAMM) version 6. The model used the 1 meter of sea-level rise by 2100 scenario and was produced for the Nature Conservancy by Warren Pinnacle Consulting, Inc. The purpose of this series of maps was to show how marshes are predicted to migrate inland due to increases in sea level by 2100. The SLAMM model produced landcover maps for 5 points in time for this specific sea level rise scenario, which included actual landcover maps from either 2004 or 2009 and predicted landcover maps for 2025, 2050, 2075 and 2100 for each project site.
Storm Surge (ADCIRC)
The following maps show the maximum predicted storm surge height for Choctawhatchee Bay and St. Andrews Bay modeled using hurricance Ivan (2004) conditions assuming a 1m rise in sea-level rise by 2100. The storm surge maps accounted for future changes in sea level rise by adjusting for local rates of subsidence, a sea level rise rate based on the 1m rise by 2100 scenario, and future landcover conditions derived from maps produced by the SLAMM model. The storm surge simulation used the SLAMM landcover maps to calculate the bottom friction resistance (Manning’s n) and wind roughness (Z0) parameters for the model. The maps represent the height in feet of the maximum predicted storm surge from mean seal level (0ft) from the North American Vertical Datum of 1988 (NAVD88) for all land and water areas that experienced a surge in the model. The three storm surge maps represent the predicted storm surge over the initial condition (2004 or 2009) and predicted storm surge maps for 2050 and 2100. The black line represents the path of the hurricane as it made landfall in the study area.
Conservation and Resilience Analysis
These projects used the sea-level rise and storm surge model results to assess the ecological and socioeconomic components at risk of such climate hazards in each of the project sites, as well as what could be considered future conservation priorities to build a resilient coastal zone. Assessments of the impacts of sea-level rise include the habitats (mostly coastal marshes) that are at risk of inundation for each scenario, and marshes within existing priority areas (protected/managed) that are at risk of inundation. The analysis also assesses the social vulnerability of coastal communities to different sea-level rise scenarios and identifies areas that need to be maintained to allow for flexibility and resilience to take effect. These analyses relate marsh advancement zones to already place-based priorities on land.