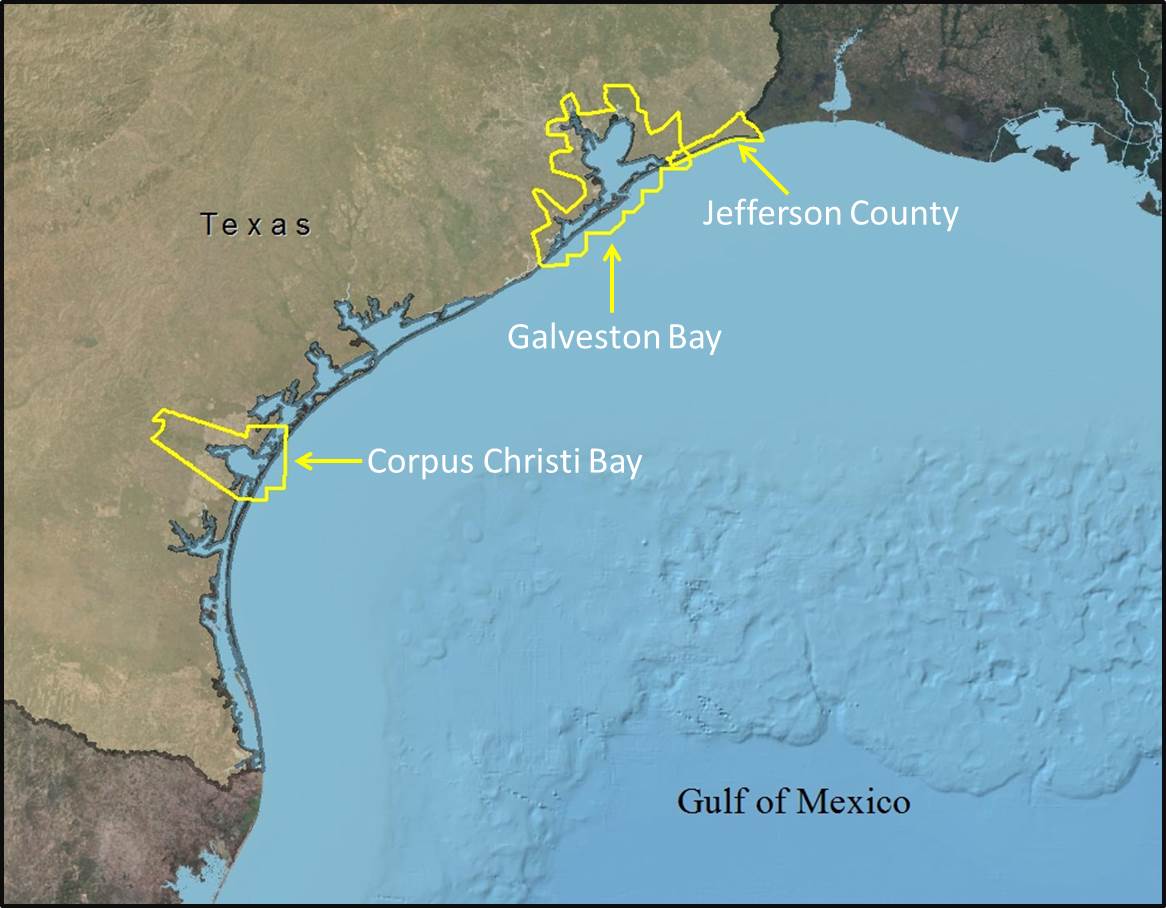
Two project sites in Texas have currently been analyzed using both the SLAMM and ADCRIC models, and conservation and resilience analyses created. These include Galveston Bay and the southern portion of Jefferson County, which are located south and northeast of Houston, respectively, in a heavily populated region along the upper Texas coast. An additional Texas site, Corpus Christi Bay, is scheduled to be analyzed in early 2013, which is located in the coastal bend of Texas.
Click to enlarge.
Study Areas:
Galveston Bay / Jefferson County
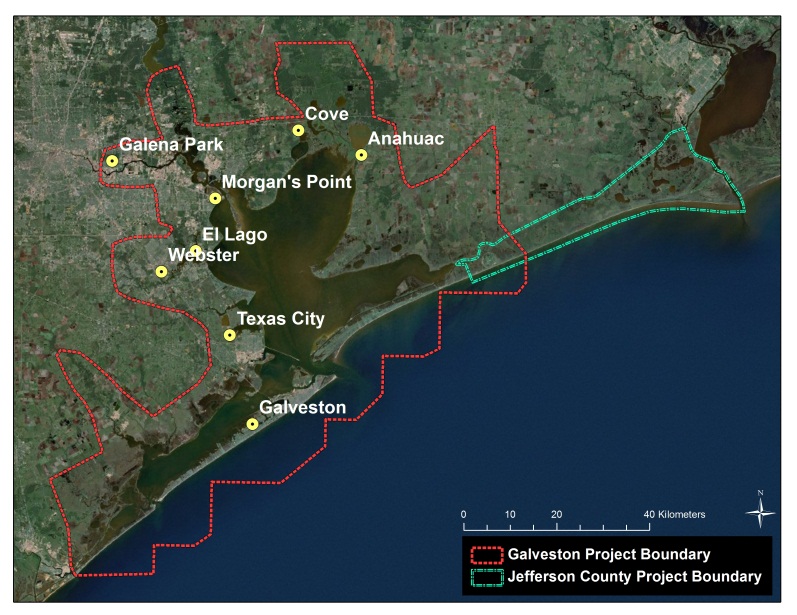
Galveston Bay and southern Jefferson County study area.
In general, the landscape around Galveston Bay area and southern Jefferson County features a mix of salt and fresh water marsh wetlands, bayous, sand beaches, but also accounts for large industrial facilities. This area holds numerous parks, preserves and priority federal and state managed areas. While the population in the entire Houston-Galveston metro area is more than six million people, the population around the Galveston Bay area is approximately 566,850 with Jefferson County population around 250,00.
The low-lying topographic terrain along the study area and proximity to the Bay and the Gulf have made this a sensitive area to sea level rise (SLR) and flooding. Land subsidence due to excessive groundwater extraction (and possibly oil and gas too) has exacerbated the vulnerability of the area to SLR. Both of these project sites have been analyzed separately using the SLAMM models, however they were combined into one site for the ADCIRC and conservation and resilience analyses.
Galveston Bay
The Galveston Bay area is a region that surrounds the Galveston Bay estuary and the Houston-Galveston Island metropolitan areas. Being the largest estuarine system in Texas, it encompasses 1.4 million acres and is a part of 6 counties around the bay area. It is situated in the northern portion of the Texas east coast and receives the drainage of both the Trinity and San Jacinto Rivers.
Jefferson County
Jefferson County is located to the east of the Galveston Bay area and is also part of the Gulf coast prairies and marshes ecoregion. This coastal county is bounded on the north by Pine Island Bayou and the Neches River, on the east by Sabine Lake and the mouth of the Sabine River, and to the south by the Gulf of Mexico. The southern part of the county largely comprises salt marsh wetland habitat. This coastal wetland environment is the portion of the county that was modeled under this initiative. It is limited to the north by the Intracoastal Water Way, and the state boundary of Louisiana to the east.
Corpus Christi Bay
Corpus Christi Bay is a semi-tropical bay on the Texas coast located in Nueces and San Patricio counties, next to the city of Corpus Christi. It is separated from the Gulf of Mexico by Padre and Mustang Islands, and its primary fresh water sources are the Nueces River and Oso Creek, which enter the bay from its western and southern extensions, Nueces Bay and Oso Bay. Located approximately 136 miles (219 km) south of San Antonio, and 179 miles (288 km) southwest of Houston. It is an important natural estuary that supports a diverse collection of wildlife, and attracts many tourists. The bay’s abundance of petroleum and natural gas has attracted industry, and its strategic location on the Texas coast is ideal for military establishment.
Analyses:
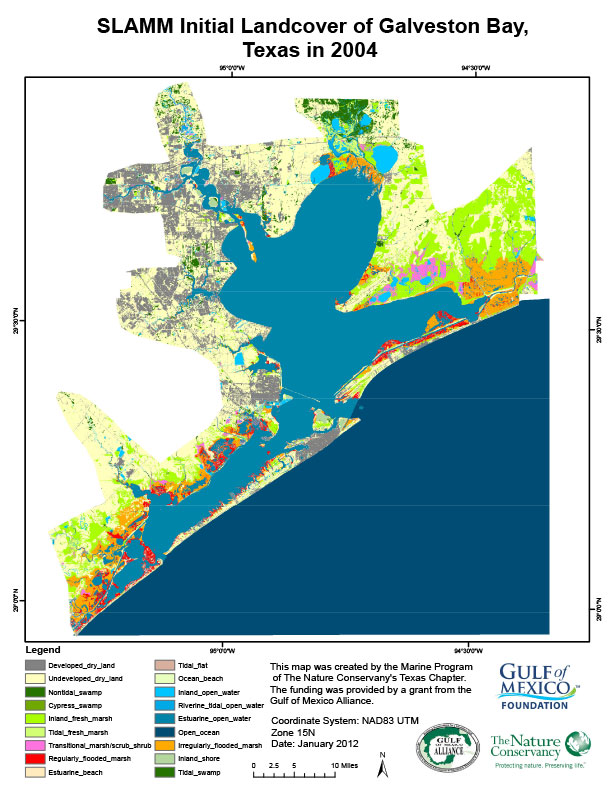
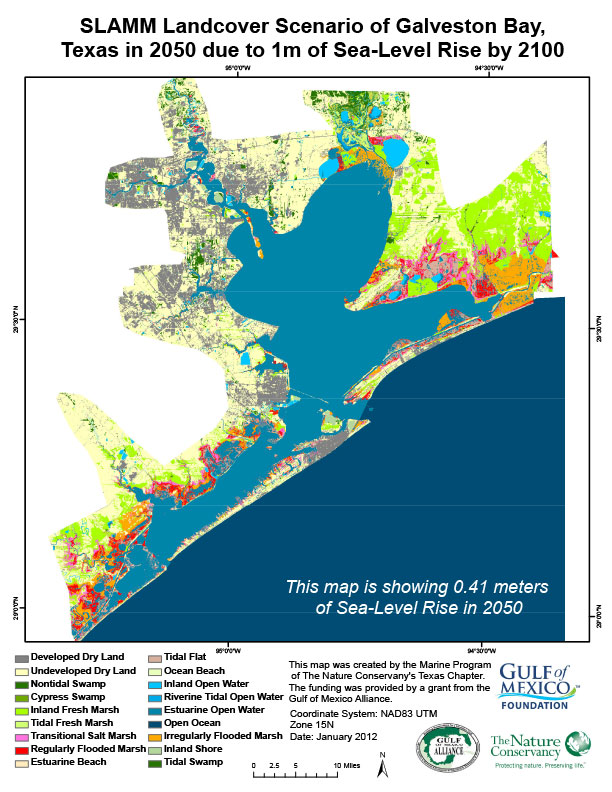
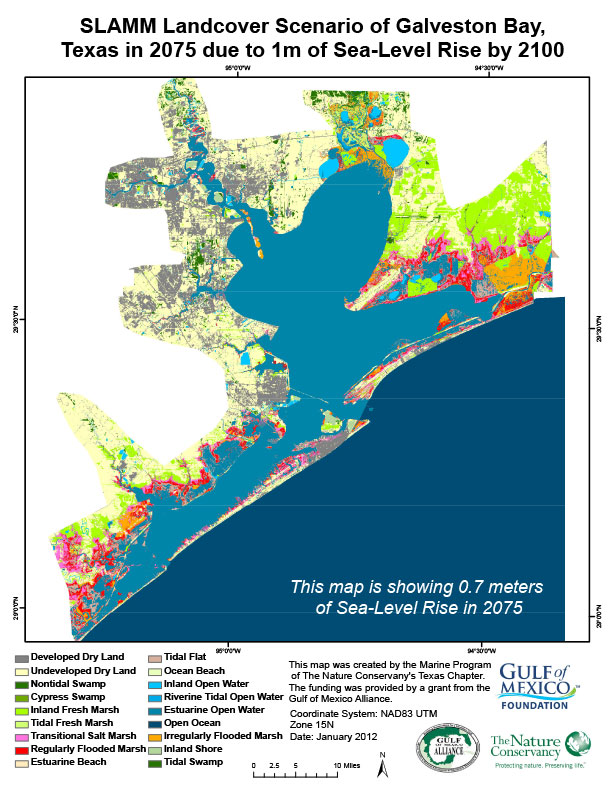
SLAMM
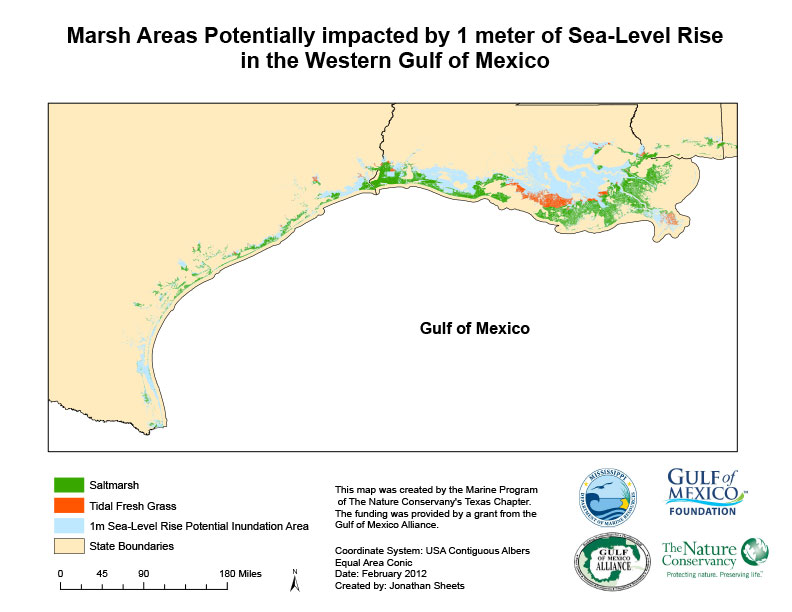
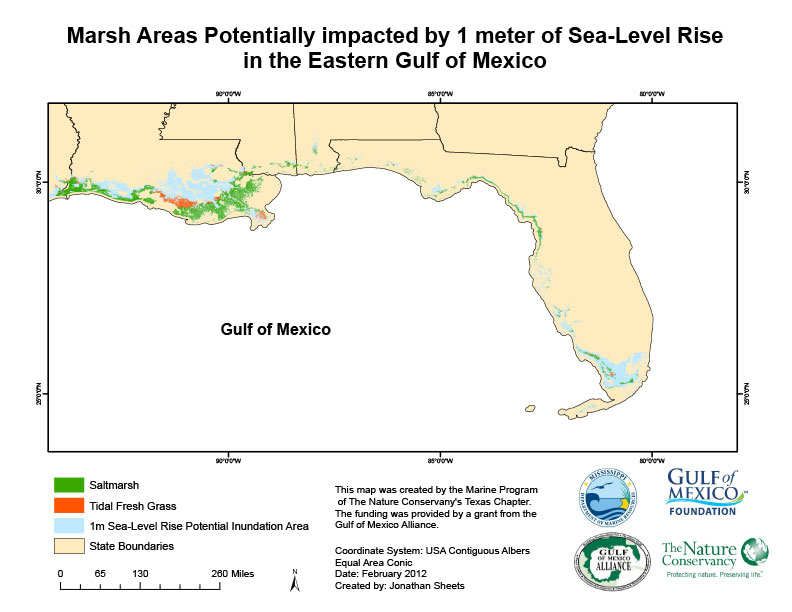
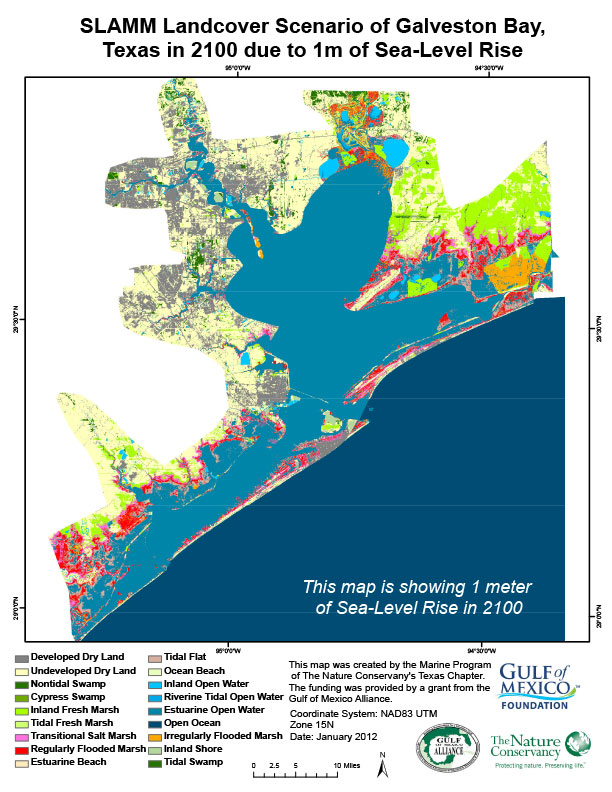
The following images show scenario maps derived from the Sea Level Rise Affecting Marsh Model (SLAMM 6.0). These images show some of the results from the 1 meter of SLR by 2100 scenario which were produced for the Nature Conservancy by Warren Pinnacle Consulting, Inc. The purpose of this series of maps was to show how marshes are predicted to migrate inland due to increases in sea level by 2100. The SLAMM model produced future landcover maps for five time slices for this specific sea level rise scenario, which included actual landcover maps from 2004 and predicted landcover maps for 2025, 2050, 2075 and 2100.

Storm Surge (ADCIRC)
The following maps show the maximum predicted storm surge height for the project sites modeled using Hurricane conditions assuming a 1m rise in sea-level rise by 2100 and were produced for the Nature Conservancy by Arcadis US, Inc. These storm surge maps accounted for future changes in sea level rise by adjusting for local rates of subsidence, a SLR rate based on the 1m rise by 2100 scenario, and future landcover conditions derived from maps produced by the SLAMM model. The maps represent the height in feet of the maximum predicted storm surge from mean seal level (0ft) from the North American Vertical Datum of 1988 (NAVD88) for all land and water areas that experienced a surge in the model.
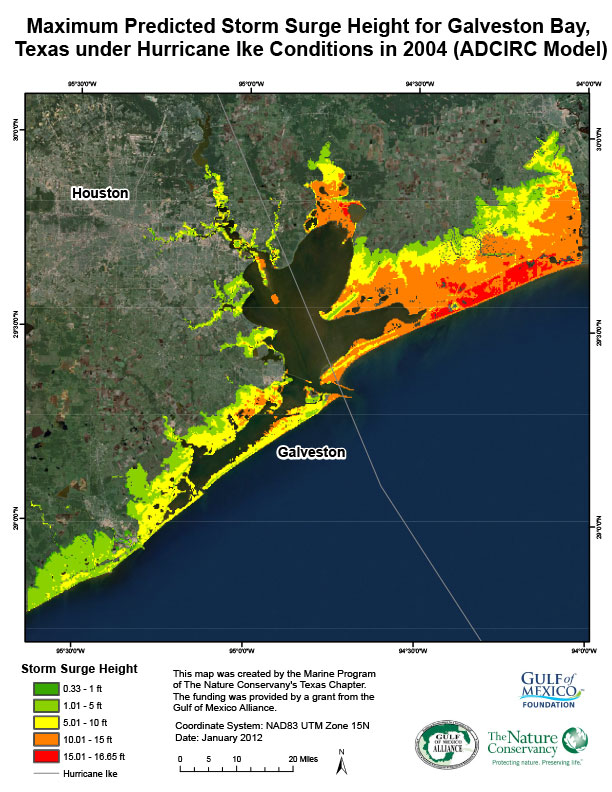
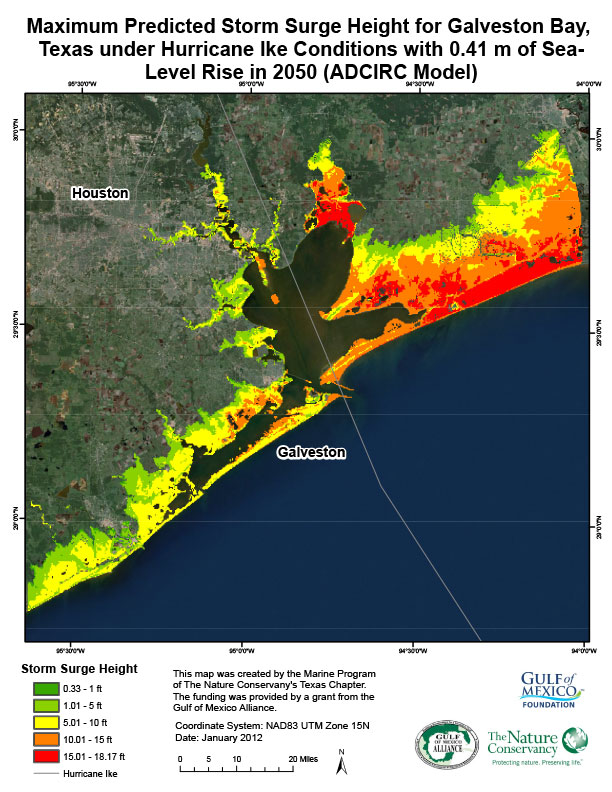
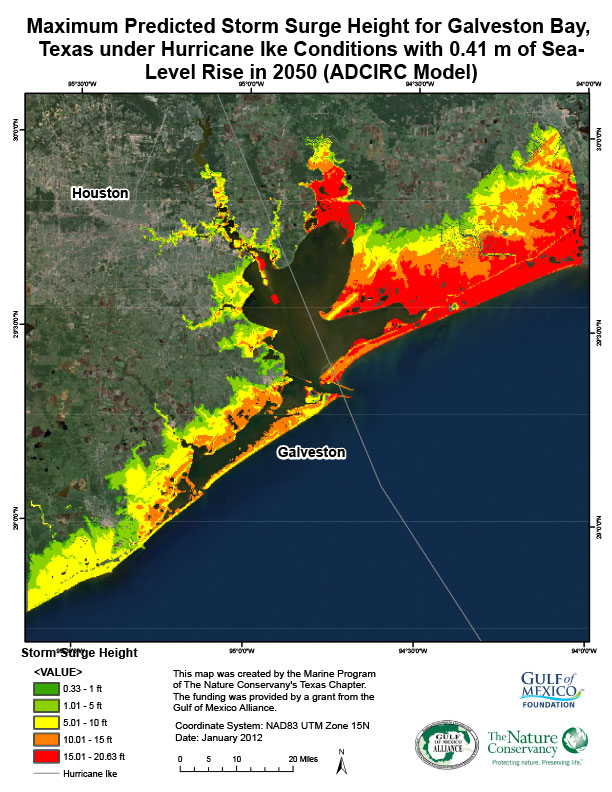
The three storm surge maps represent the predicted storm surge over the initial condition and predicted storm surge maps for 2050 and 2100. The black line represents the path of the hurricane as it made landfall in the study area.
Conservation and Resilience Analysis
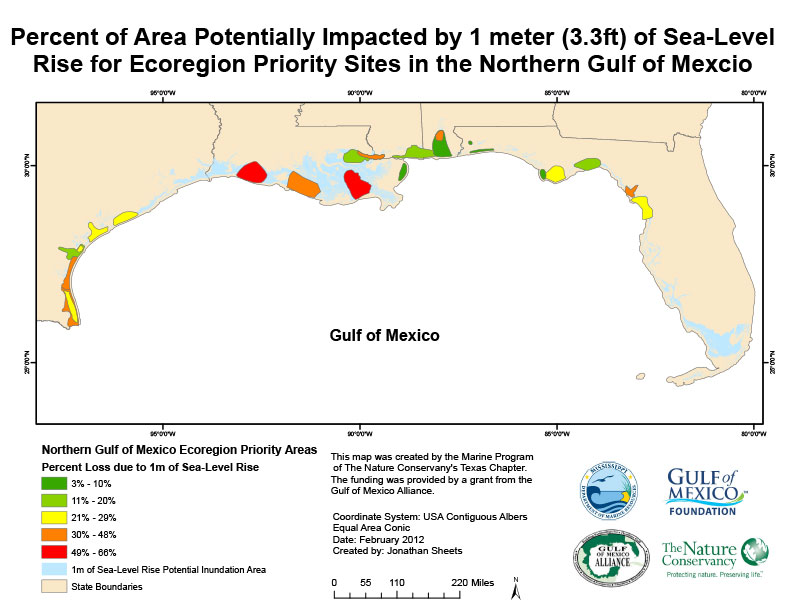
These spatial analyses used the SLR and storm surge scenarios to assess the ecological and socioeconomic components at risk of such climate hazards in each of the project sites, as well as what could be considered future conservation priorities to build a resilient coastal zone. Assessments of the impacts of SLR include the habitats (mostly coastal marshes) that are at risk of inundation for each scenario, and marshes within existing priority areas (protected/managed) that are at risk of inundation. The analysis also assesses the social vulnerability of coastal communities to different SLR scenarios and identifies areas that need to be maintained to allow for flexibility and resilience to take effect. These analyses relate marsh advancement zones to already place-based priorities on land.